#1 Google Earth Engine: A Comprehensive Guide for Data Analysis and Visualization

Google Earth Engine

In the age of big data, the ability to analyze and visualize geospatial information is more critical than ever. Google Earth Engine (GEE) is a powerful platform designed to handle this very task, offering unparalleled capabilities for data analysis and visualization. Whether you’re a researcher, data scientist, or environmental analyst, GEE can significantly enhance your ability to interpret complex geospatial data. In this comprehensive guide, we’ll delve into the features of Google Earth Engine, its practical applications, and how you can leverage it to achieve your goals.

What is Google Earth Engine?

GEE is a cloud-based platform developed by Google for planetary-scale environmental data analysis. It provides access to a vast archive of satellite imagery and geospatial datasets, enabling users to process and analyze data at scale without needing extensive computing resources.

[Google Earth Engine]

Key Features of Google Earth Engine

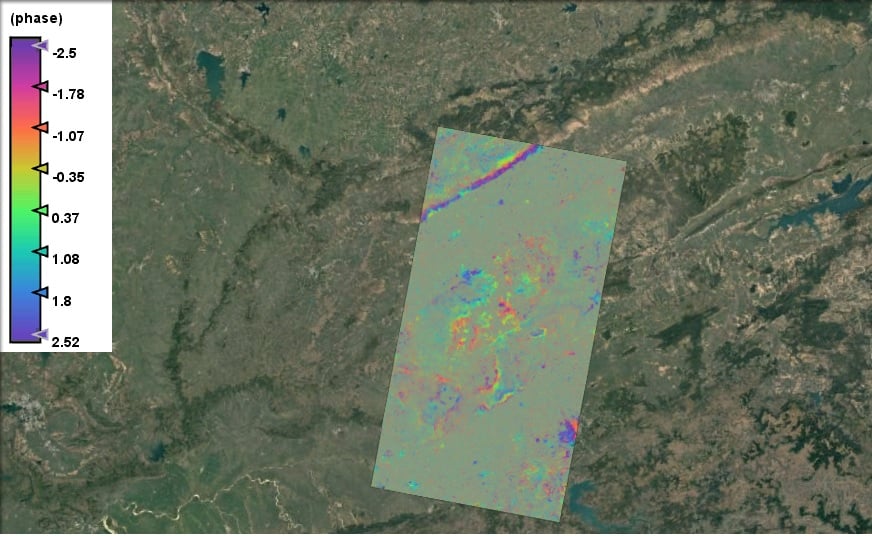
  1. Extensive Data Archive: Google Earth Engine hosts a comprehensive collection of satellite imagery and geospatial datasets, including data from Landsat, Sentinel, MODIS, and more. This archive spans several decades, offering valuable insights into long-term environmental changes.
  2. Powerful Computational Tools: The platform provides a robust suite of tools for processing and analyzing large datasets. Users can perform complex computations, apply machine learning algorithms, and generate custom analyses efficiently.
  3. Scalability: Google Earth Engine operates on Google’s cloud infrastructure, allowing users to run large-scale computations without the limitations of local hardware.
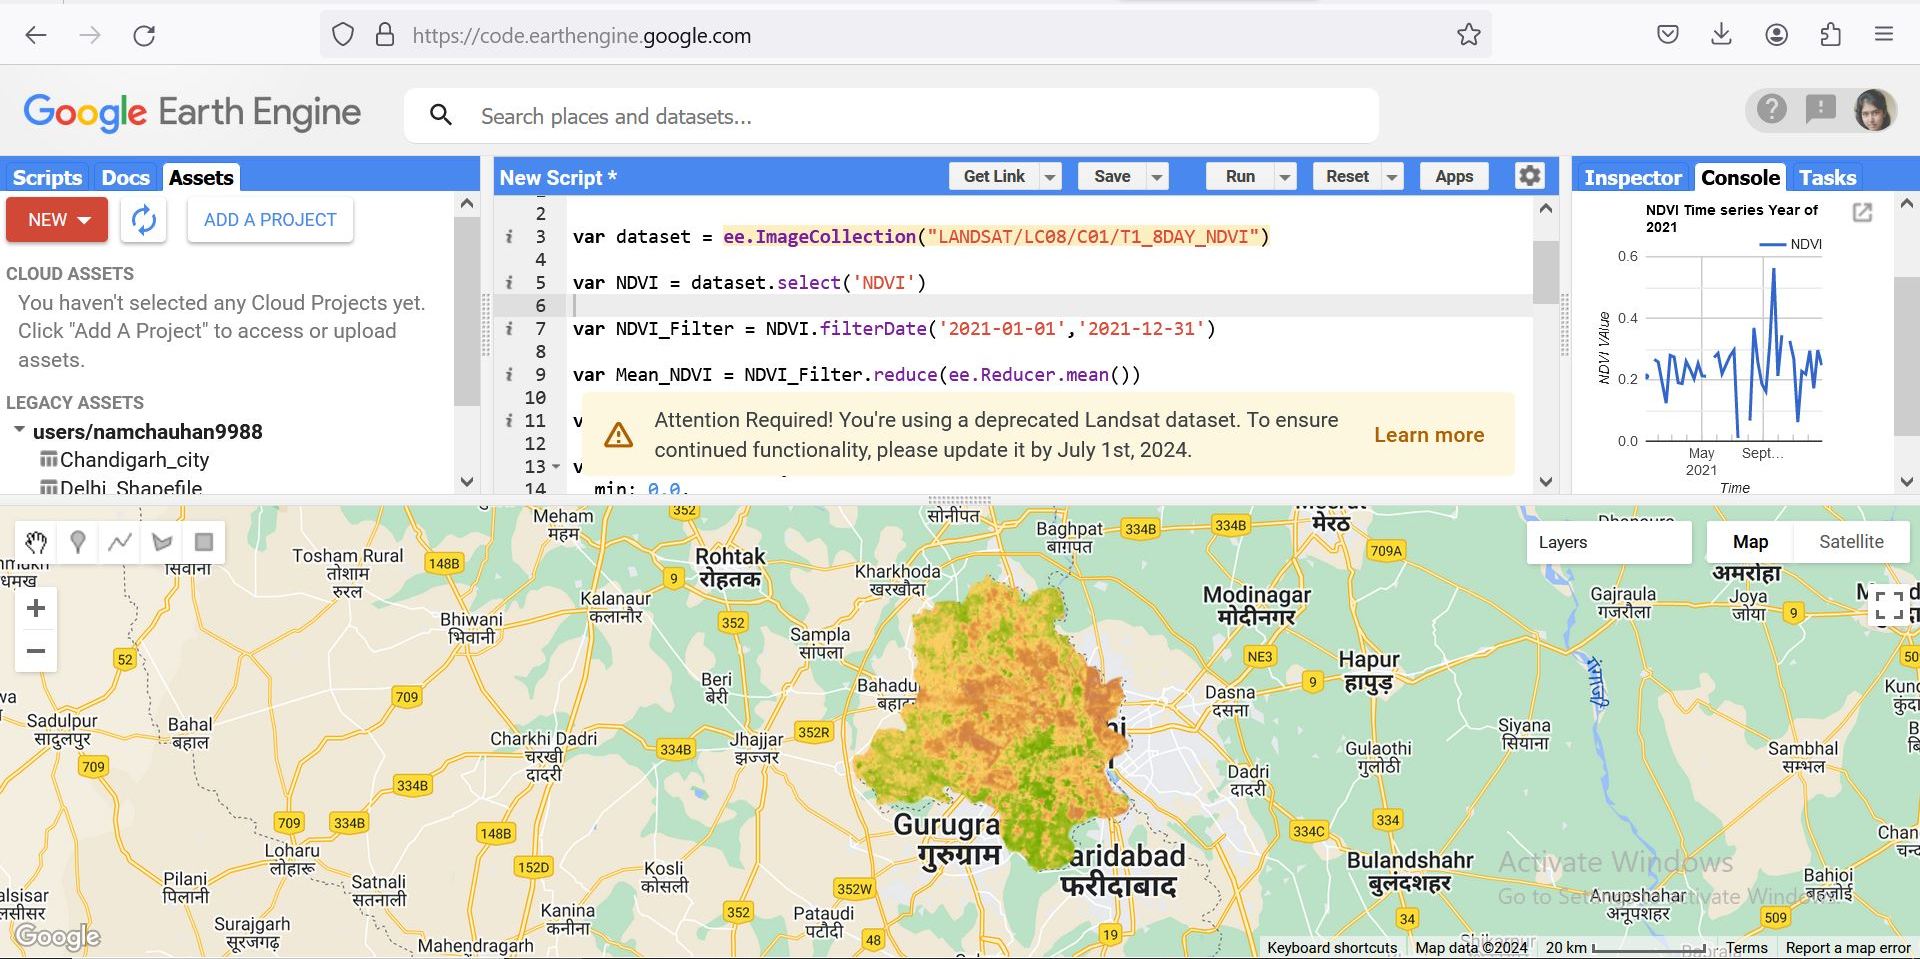
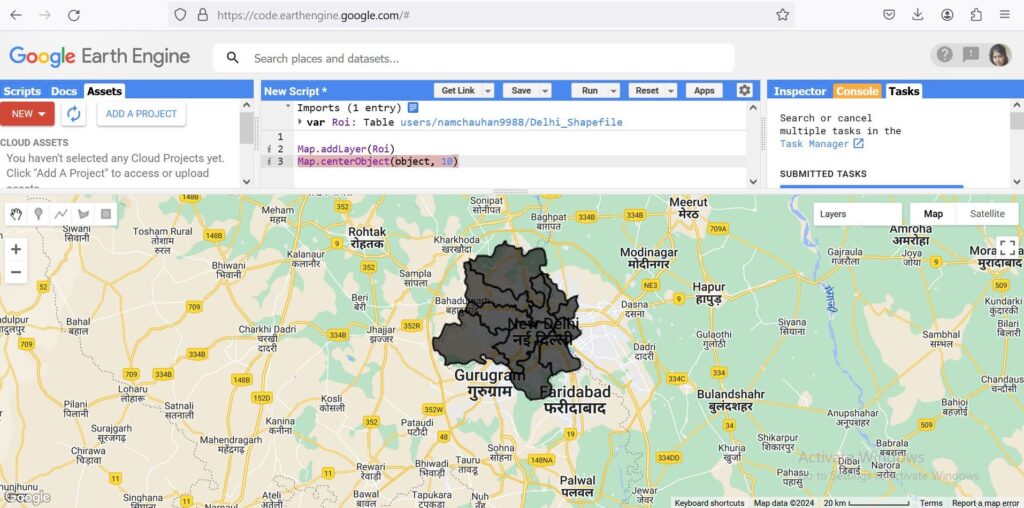
  4. User-Friendly Interface: The Earth Engine Code Editor offers an intuitive environment for coding and visualizing results. It supports JavaScript and Python, catering to a range of programming preferences.
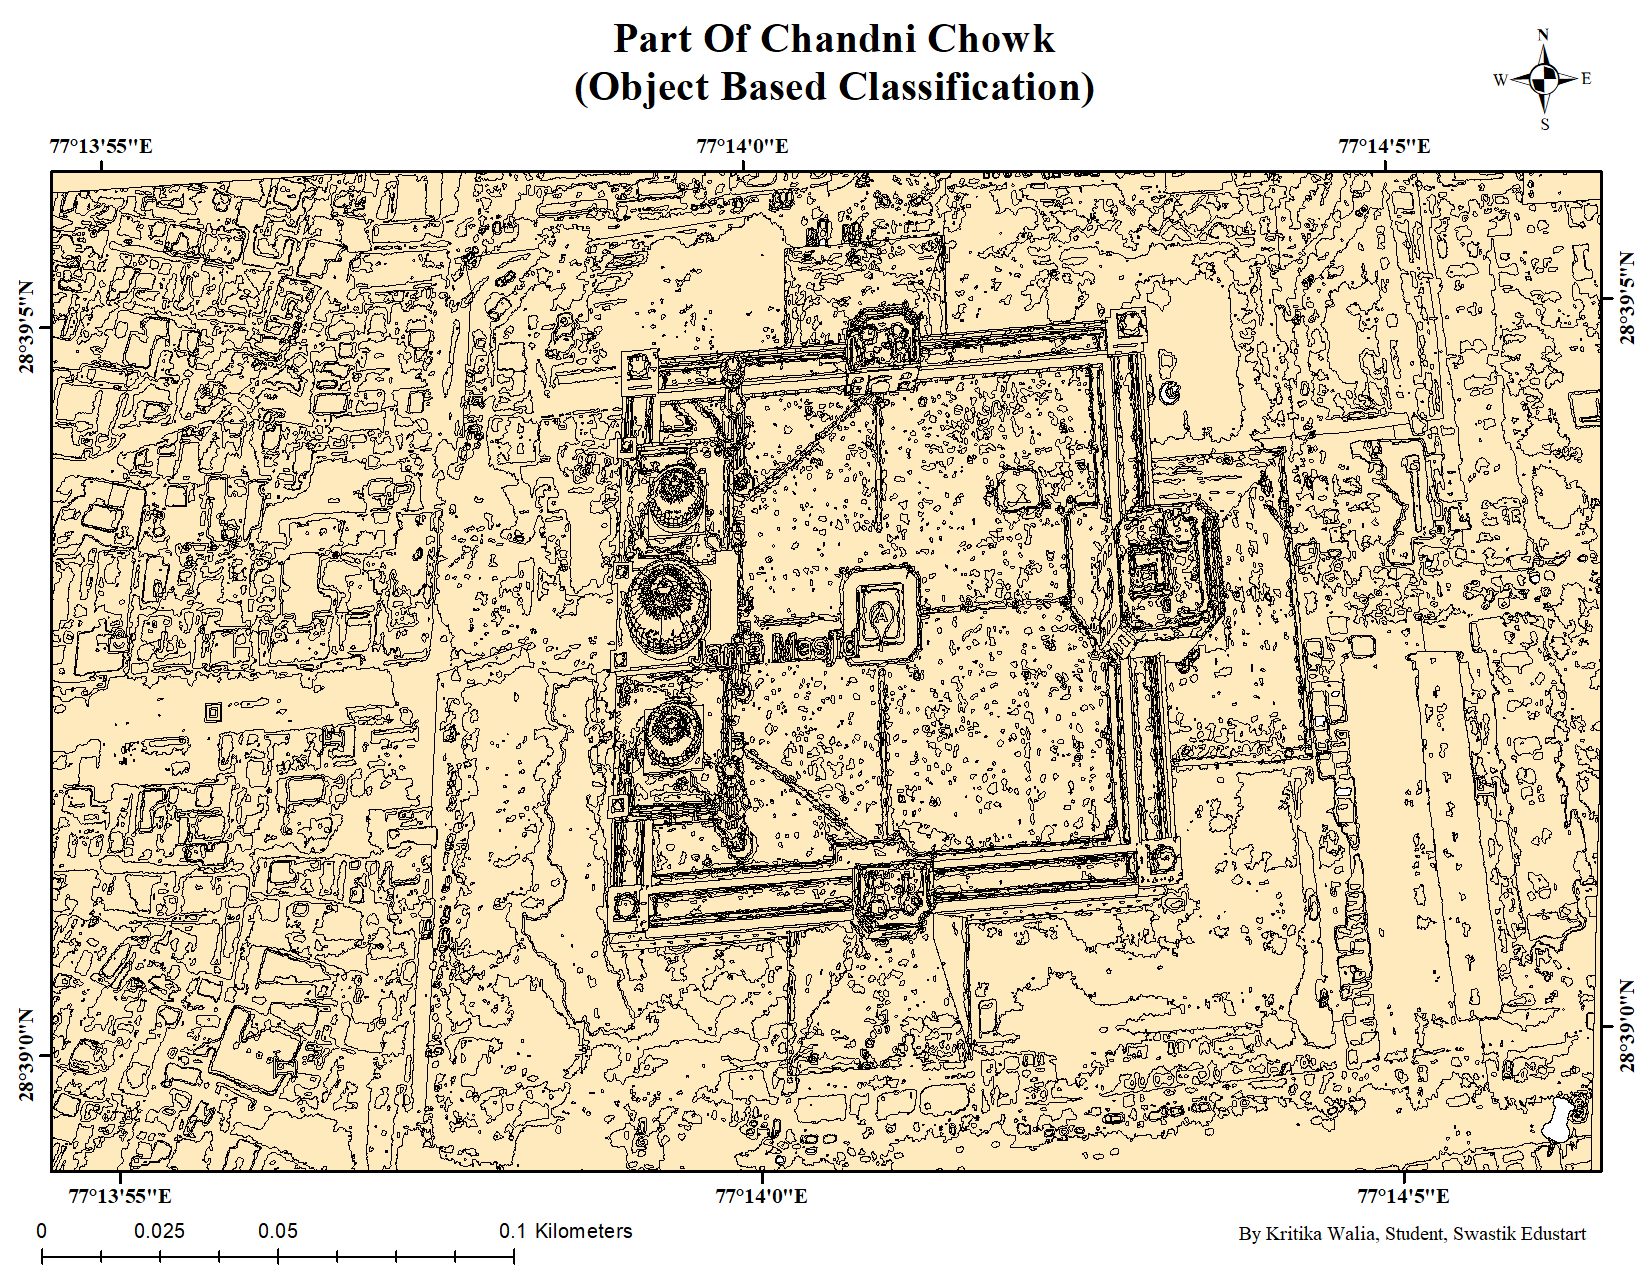
  5. Visualization Capabilities: With GEE, users can create detailed visualizations of geospatial data, including interactive maps and graphs, to communicate findings effectively.

Practical Applications of Google Earth Engine

  1. Environmental Monitoring: Researchers use GEE to monitor deforestation, track changes in land cover, and analyze the impacts of climate change. For example, the tool has been used to study the deforestation rates in the Amazon rainforest and assess the effects of wildfires.
  2. Disaster Response: GEE plays a critical role in disaster management by providing real-time data and analysis for natural disasters such as floods, hurricanes, and earthquakes. This helps in planning emergency responses and assessing damage.
  3. Agriculture and Land Use: Agriculturalists leverage GEE for precision farming, crop monitoring, and land use planning. By analyzing satellite imagery, they can optimize crop yields and manage resources more efficiently.
  4. Urban Planning: Urban planners use GEE to analyze urban growth, plan infrastructure, and assess environmental impacts. The platform’s ability to process and visualize large datasets supports informed decision-making in urban development.

Getting Started with Google Earth Engine

To start using Google Earth Engine, follow these steps:

  1. Sign Up for Access: Visit the Google Earth Engine website and sign up for access. You’ll need a Google account to get started.
  2. Explore the Code Editor: Once you have access, familiarize yourself with the Earth Engine Code Editor. This is where you’ll write and execute scripts.
  3. Utilize Tutorials and Documentation: Google Earth Engine provides extensive documentation and tutorials to help you get started. These resources cover everything from basic operations to advanced techniques.
  4. Join the Community: Engage with the Google Earth Engine community to share insights, ask questions, and collaborate with other users.

Integrating Google Earth Engine with Other Tools

GEE can be integrated with various tools and platforms to enhance its functionality:

  • Google Maps API: For visualizing GEE data on interactive maps, you can use the Google Maps API to embed custom maps into web applications.
  • QGIS and ArcGIS: These GIS platforms can import GEE outputs for further analysis and visualization. Learn more about integrating GEE with QGIS and ArcGIS.
  • Machine Learning Libraries: Combine GEE with machine learning libraries such as TensorFlow or Scikit-Learn for advanced data analysis and predictive modeling.

Conclusion

GEE is a transformative tool for geospatial data analysis and visualization, offering extensive data resources and computational power to tackle complex environmental and urban challenges. By leveraging its capabilities, you can gain valuable insights, improve decision-making, and contribute to a better understanding of our planet.

To stay updated on the latest developments and best practices in geospatial data analysis, follow our blog and explore additional resources.

Internal Links:

External Links:

Conclusion

Hashtags: #GoogleEarthEngine #GeospatialData #RemoteSensing #DataAnalysis #EarthObservation

Mapping Object-Based Classification: A Comprehensive Guide

Object-based-classification

Object-based or object-oriented classification represents a significant advancement in the field of remote sensing and image analysis. Unlike traditional pixel-based classification methods, object-based classification leverages both spectral and spatial information, offering a more nuanced and accurate categorization of pixels. This approach closely mimics the way humans interpret visual information, considering not just individual pixel values but also the context and relationships between pixels.

Understanding Object-Based Classification

Object-based classification involves two primary steps: segmentation and classification. Here’s a detailed look at each step:

  1. Segmentation: The initial step involves dividing the image into meaningful objects or features. These objects are groups of pixels that share similar spectral characteristics, such as color, as well as spatial attributes like size, shape, and texture. This segmentation process creates a set of image objects that serve as the basic units for further analysis.
  2. Classification: Once the image is segmented, each object is then classified based on its spectral and spatial characteristics. This step incorporates information from the surrounding pixels, enhancing the accuracy of the classification.

Advantages of Object-Based Classification

Object-based classification offers several advantages over traditional pixel-based methods:

  • Incorporation of Spatial Information: By considering the spatial relationships and context of pixels, object-based classification provides a more comprehensive understanding of the image data.
  • Improved Accuracy: The method reduces the salt-and-pepper effect common in pixel-based classification, leading to more accurate and visually appealing results.
  • Versatility: This approach can handle complex scenes with varying textures and patterns, making it suitable for diverse applications such as urban planning, agriculture, and environmental monitoring.

Key Components of Object-Based Classification

Several factors play a crucial role in the success of object-based classification:

  • Spectral Characteristics: The color or reflectance values of the pixels within an object are critical for distinguishing between different classes.
  • Shape: The geometric shape of the objects helps in identifying features such as buildings, roads, or natural formations.
  • Texture: The surface texture within the objects, defined by the variation in pixel values, aids in differentiating between rough and smooth surfaces.
  • Spatial Context: The relationship between adjacent objects and their surroundings provides additional information that enhances classification accuracy.

Applications of Object-Based Classification

The versatility of object-based classification makes it applicable across various domains:

  • Urban Planning: Accurately mapping urban areas, identifying land use patterns, and monitoring changes over time.
  • Agriculture: Classifying crop types, assessing crop health, and optimizing agricultural practices.
  • Environmental Monitoring: Tracking deforestation, land degradation, and habitat changes to support conservation efforts.

Conclusion

Object-based classification represents a significant evolution in remote sensing and image analysis, offering a more detailed and accurate approach to categorizing pixels. By integrating spectral and spatial information, this method mimics human visual interpretation, resulting in superior classification results. Whether for urban planning, agriculture, or environmental monitoring, object-based classification provides a powerful tool for extracting meaningful information from complex imagery.

Embrace the power of object-based classification to unlock deeper insights and achieve more accurate mapping in your projects.

Monitoring Land Subsidence in Jabalpur: Interferogram Using Sentinel-1 SAR Imagery

interferogram_SAR

Land subsidence is a critical issue affecting many regions worldwide, often resulting from natural processes or human activities such as groundwater extraction, mining, or construction. Monitoring and understanding these changes are vital for urban planning, infrastructure maintenance, and environmental conservation. Our student Kartikey has taken a significant step in this direction by creating an interferogram using Sentinel-1 Synthetic Aperture Radar (SAR) imagery to monitor land subsidence in Jabalpur, Madhya Pradesh.

What is InSAR?

Interferometric Synthetic Aperture Radar (InSAR) is a powerful remote sensing technique that uses radar signals from Earth-orbiting satellites to measure changes in land surface altitude with remarkable precision. By comparing radar images taken at different times, InSAR can detect and map even minute surface deformations over large areas. This method provides high-density measurements and exceptional spatial detail, making it an invaluable tool for studying land subsidence, earthquakes, and other geophysical phenomena.

Kartikey’s Project: Monitoring Jabalpur

Data Acquisition and Processing

Kartikey utilized data from the Sentinel-1 satellites, part of the European Space Agency’s Copernicus program. Sentinel-1 provides continuous all-weather, day-and-night radar imagery, which is ideal for monitoring surface changes over time. The specific focus of Kartikey’s project was Jabalpur, a city in Madhya Pradesh known for its geological activity and susceptibility to land subsidence.

Creating the Interferogram

An interferogram is essentially a visual representation of phase differences between two SAR images taken at different times. These phase differences can indicate changes in land surface altitude. Kartikey processed pairs of Sentinel-1 images using specialized software to generate the interferogram. This involved:

  1. Image Preprocessing: Correcting for geometric distortions and aligning the images precisely.
  2. Interferogram Generation: Calculating the phase difference between the two images.
  3. Phase Unwrapping: Converting the phase difference information into meaningful displacement data.
  4. Geocoding: Translating the displacement data into a map that accurately represents the geographic area of interest.

Analyzing the Results

The interferogram created by Kartikey revealed significant insights into the land subsidence patterns in Jabalpur. By analyzing the displacement data, it was possible to identify areas experiencing varying degrees of subsidence. The high resolution and spatial detail of the interferogram allowed for precise pinpointing of subsidence hotspots, which can be crucial for urban planners and policymakers in mitigating potential risks.

Implications and Future Directions

Kartikey’s work exemplifies the practical application of advanced remote sensing techniques in addressing real-world problems. The detailed subsidence map of Jabalpur can serve multiple purposes:

  • Urban Planning: Helping authorities to make informed decisions about land use and construction.
  • Infrastructure Maintenance: Identifying areas where subsidence could pose a risk to buildings, roads, and other infrastructure.
  • Environmental Conservation: Monitoring and mitigating the impacts of subsidence on natural landscapes.

Future directions for this research could include extending the monitoring to other regions prone to subsidence, incorporating more frequent SAR acquisitions for real-time monitoring, and integrating InSAR data with other geospatial datasets for a comprehensive analysis of land surface dynamics.

Conclusion

Kartikey’s innovative use of Sentinel-1 SAR imagery to create an interferogram for monitoring land subsidence in Jabalpur highlights the significant potential of InSAR technology. By providing high-resolution, detailed measurements of surface changes, InSAR enables better understanding and management of geological processes. This project not only contributes valuable data to the scientific community but also offers practical benefits for urban development and environmental management in Jabalpur and beyond.

Through projects like this, our students continue to push the boundaries of what is possible with remote sensing technology, demonstrating its critical role in addressing contemporary geospatial challenges.

This project not only showcases Kartikey’s technical expertise and innovative approach but also underscores the importance of remote sensing in tackling geospatial challenges. By leveraging InSAR technology, the study provides a detailed subsidence map that can aid in proactive decision-making, ensuring safer urban environments and sustainable land management practices in Jabalpur.

Exploring the 7 Most Important Features of Google Earth Engine for GIS

Google Earth Engine

Geographic Information Systems (GIS) have revolutionized how we understand and interact with the world around us. Among the various tools available to GIS professionals and enthusiasts, Google Earth Engine (GEE) stands out as a transformative platform, offering unparalleled capabilities for environmental monitoring, spatial analysis, and decision-making. Here’s why Google Earth Engine is so crucial in the realm of GIS.

1. Massive Data Repository

Google Earth Engine provides access to an extensive archive of satellite imagery and geospatial datasets, including historical data spanning several decades. This wealth of information allows users to analyze changes over time, making it invaluable for research in areas such as climate change, deforestation, urbanization, and disaster management.

2. Cloud-Based Processing Power

One of the significant challenges in GIS is the need for substantial computational resources to process large datasets. GEE’s cloud-based infrastructure eliminates this hurdle by leveraging Google’s powerful servers. Users can perform complex analyses and run sophisticated algorithms without needing high-end local hardware, making advanced GIS accessible to a broader audience.

3. Scalability and Speed

The ability to scale operations quickly is a key advantage of Google Earth Engine. Whether you are analyzing a small area or conducting a global study, GEE can handle the task efficiently. Its cloud infrastructure ensures that even large-scale projects can be completed swiftly, which is critical for timely decision-making in areas like disaster response and environmental monitoring.

4. Integrated Development Environment

Google Earth Engine comes with an integrated development environment (IDE) that supports JavaScript and Python, allowing users to write and execute code directly in their web browser. This feature simplifies the process of developing, sharing, and replicating analyses. The platform also includes a rich library of pre-built functions and tutorials, aiding both novice and experienced users in their work.

5. Collaboration and Sharing

Collaboration is at the heart of modern scientific research and planning. GEE facilitates this by enabling users to share their projects, datasets, and scripts easily. Collaborative projects can span across institutions and countries, fostering a global approach to solving environmental and geographical problems.

6. Real-Time Data and Monitoring

For applications requiring real-time data, such as disaster response or agricultural monitoring, GEE’s ability to ingest and process near real-time satellite imagery is crucial. Users can monitor events as they happen and deploy rapid response measures based on the latest data, enhancing the efficacy of interventions.

1st Assignment Study area in GEE

7. Environmental and Social Impact

GEE has been instrumental in various high-impact projects around the world. From tracking deforestation in the Amazon rainforest to assessing the impacts of climate change on polar ice caps, the insights gained through GEE have informed policy decisions, conservation efforts, and sustainable development initiatives.

Conclusion – Google Earth Engine

Google Earth Engine is more than just a tool; it is a catalyst for innovation in GIS. Its combination of vast data resources, powerful cloud-based processing, and user-friendly features makes it an indispensable asset for researchers, planners, and policymakers. By democratizing access to advanced geospatial analysis, GEE is playing a crucial role in addressing some of the most pressing environmental and social challenges of our time. Whether you are a seasoned GIS professional or a curious newcomer, exploring the capabilities of Google Earth Engine can open up new horizons in your work and research.

Post Graduate Diploma in Geoinformatics (12M)

PG DIPLOMA IN GEOINFORMATICS Course Highlights Course Name PG Diploma in Geoinformaitcs Affiliation Authorised Training Center of ITT Council Duration 12 Months (9 Months Training and 3 Months Internship/Project) Eligibility Graduation /UG- Result Awaited Placement Assistance Yes Fee Structure Rs. 49,000/- (Course Fee) + Rs. 2000/- (Exam Fee) Mode of Training Offline – Delhi / … Read more

× How can I help you?