A Digital Elevation Model (DEM) is a digital cartographic dataset that represents a continuous topographic
elevation surface through a series of cells. Each cell represents the elevation (Z) of a feature at its location (X
and Y). Digital Elevation Models are a “bare earth” representation because they only contain information
about the elevation of geological (ground) features, such as valleys, mountains, and landslides, to name a
few. They do not include any elevation data concerning non-ground features, such as vegetation or
buildings.
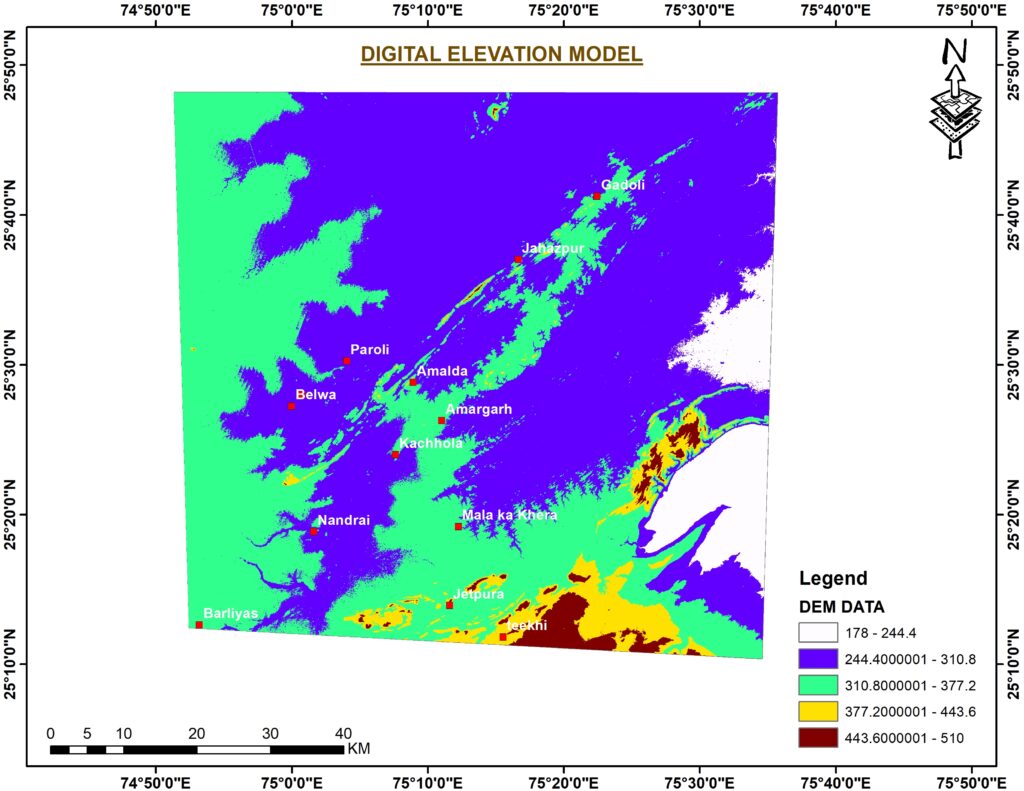
In the above Map DEM define the different elevation of Land in Study area, DEM data is classified into 5
Classes of interval respect to their heights:
I. Range (178-244.4): Covers eastern Part of study area
II. Range (244.4-310.8): It shows Slight elevation or undulation in land that covers majorly Belwa,
Paroli, Nandrai and some part of Jahazpur region
III. Range (310.8-377.2): Covers Amalda, Amargarh, Jetpura regions.
IV. Range (443.3-510): This is the highest elevation area in the study region and covers Teekhi region
here, some small height hills are found which has there geological significance.
Importance of DEMs and its Uses
Digital Elevation Models are a core spatial dataset required for many environmental, planning, and scientific
applications. A few examples are highlighted below.
- Environmental planning
- Military applications
- Emergency responses
- Hydrological functions: including drainage basin network assessments, understand drainage
patterns, flood modelling and risk analysis - Slope and aspect models: created for thematic classification datasets and to generate hazard maps.
- Transportation planning
- Geological survey and analyses
- Landscape archaeology: for example, using DEMs to search for microreliefs in the landscape, or
monitoring changes in glacier ice-volume can also be determined by comparing DEM datasets
generated at different times. - Topographic maps are also produced with DEMs.
- Maritime transportation: Bathymetric data can be used to create nautical charts, monitor changes
in coastline features, create conservation maps, and create important scientific models.
❖ In-Depth Analysis
DEMs are good for landscape analysis. There are many more advanced and
specialized functions and applications in ArcMap that can be used for analysis. This
includes, but is not limited to, hydrologic analysis, geologic and geomorphic analysis
and landscape development.
❖ It is also possible to do calculations with raster data. The DEM elevation values can be
used for this, but another option is to reclassify the map and give each class a certain
value that is used in a function. This can easily be displayed in a model,