GENERAL INTRODUCTION
Remote sensing is the process of detecting and monitoring the physical characteristics of an area by measuring its reflected and emitted radiation at a distance (typically from satellite or aircraft). Special cameras collect remotely sensed images, which help researchers “sense” things about the Earth.
One of the best examples for collecting satellite images is from LANDSAT-8 satellite.
launched on February 11, 2013, from Vandenberg Air Force Base, California, on an Atlas-V 401 rocket
Altitude: 705 km
Inclination: 98.2°
Orbit: polar, sun-synchronous
Period of Revolution: 99 minutes; ~14.5 orbits/day
Repeat Coverage: 16 days
Data: 12-bit scaled to 16-bit integers
Landsat 8 satellite payload consists of two science instruments—the Operational Land Imager (OLI) and the Thermal Infrared Sensor (TIRS).
The Operational Land Imager (OLI) produces 9 spectral bands (Band 1 to 9) at 15, 30, and 60-meter resolution. The Thermal Infrared Sensor (TIRS) consists of 2 thermal bands with a spatial resolution of 100 meters.
Operators: NASA (National Aeronautics and Space Administration), USGS (United States Geological Survey)
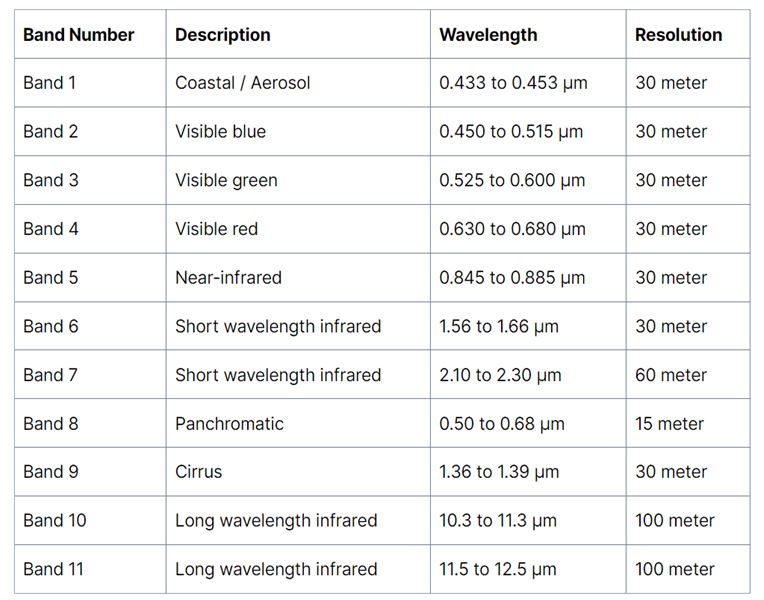
- The Operational Land Imager (OLI) provides two new spectral bands in respect to the Landsat-7 ETM+ instrument, one tailored especially for detecting cirrus clouds (band 9, new Near Infra-Red (NIR) band) and the other for coastal zone observations (band 1, new deep blue visible channel). It measures in the visible, NIR, and Shortwave Infra-Red (SWIR) portions of the electromagnetic spectrum and offers 15 metre panchromatic, and 30 metre multi-spectral spatial resolution.
- The Thermal Infrared Sensor (TIRS) was added to the Landsat-8 payload to continue thermal imaging and to support emerging applications such as evapotranspiration rate measurements for water management. TIRS was built by NASA Goddard Space Flight Centre, and it has a three-year design life.
**For further interpretation we then stack layers and then combine the bands according to the features appropriately visible. Bands can be combined ad arranged in a such unique way as to extract new and useful information.
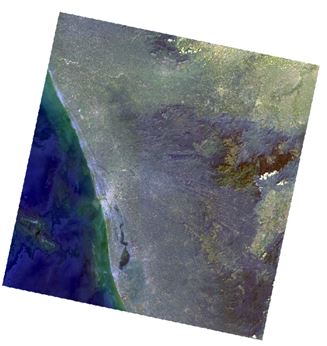
NATURAL COLOR (4,3,2): uses red, green and blue band combination; human eye resolution; healthy vegetation is green, unhealthy flora is brown; urban features appear white and grey and water is dark blue or black.
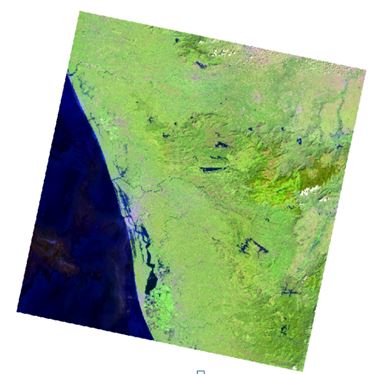
COLOR INFRARED (5,4,3):also called near IR (NIR) composite; uses near infrared, red and green band combinations; useful for analysing vegetation; areas in red have better vegetation health; dark areas are water and urban areas are white.
SHORT WAVE INFRARED (7,6,4): uses SWIR 2, SWIR 1 and red band combinations; displays vegetation in shades of green; while darker shades of green indicate denser vegetation, sparse vegetation has lighter shades; urban areas are blue and soils have various shades of brown.
AGRICULTURE (6,5,2): uses SWIR 1, NIR and blue band combinations; commonly used for crop monitoring because of the use of short-wave and near-infrared; healthy vegetation appears dark green; but bare earth has a magenta hue.
GEOLOGY (7,6,2):uses SWIR 2, SWIR 1 and blue band combinations; useful for identifying geological formations, lithology features, and faults.
BATHYMETRIC (4,3,1): uses red, green and coastal bands to peak into the water; coastal band is useful in coastal, bathymetric, and aerosol studies because it reflects blues and violets; this band combination is good for estimating suspended sediment in the water.
IMAGE INTERPREATION KEYS:
- Tone
- Pattern
- Shape
- Color
- Area
- Size
- Texture
- Shadow
STEPS INVOLVED/METHODOLOGY:
- Open USGS Earth Explorer.
- Select the appropriate place you wish to study and set the data sets as required like Landsat 8 > Landsat collection level 1 and 2 > Landsat 8-9 OLI/TIRS C2 L1 AND Landsat 8-9 OLI/TIRS C2 L2.
- Check the results and see which image has less/no cloud cover. Download the image folder.
- Open ArcMap> add data > add the files downloaded > add all the band layers till band 8.
- Now apply the tool band composite to all the band layers.
- Colourful image will appear.
- After that combine the bands as per the output you want.
ANALYSIS:
CASE STUDY AREA: KERALA COAST
- Natural color (4,3,2)
Black/dark blue: water (smooth)
Light green hue: vegetation
Brown: barren land (poor vegetation)
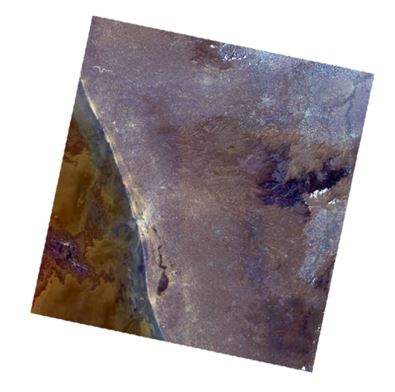
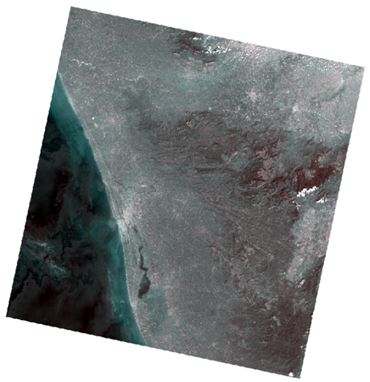
After applying the tool band composite initially, the band 1, band 2 and band 3 combination will appear.
golden color: represents water(smooth)
dark blue: barren land (rough texture)
light brown with hue: vegetation
2.Color Infrared (5,4,3)
Dark green/blue: water
Dark Red: healthy vegetation
Light red: sparse vegetation
White: settlement areas

3.Short Wave Infrared (7,6,4)
Light green shade: sparse vegetation
Dark blue/ black color: water
Blue and grey: urban areas (settlement zone)
4.AGRICULTURE (6,5,2)
Green: vegetation cover
Dark blue: water(smooth)
Light purple: urban areas (settlement zone)
Light pink to white color: barren land