Webinar: All You Need to Know About GIS Developer – Register Now! Webinar: All You Need to Know About GIS Developer – Register Now! Read More »
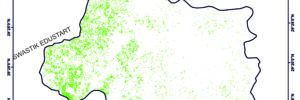
Agriculture Mapping in Panipat: Unlocking Potential for Sustainable Farming Agriculture Mapping in Panipat: Unlocking Potential for Sustainable Farming Read More »
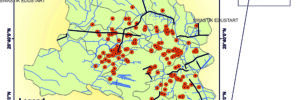
Analyzing School Concentration in Aligarh: A Hotspot Analysis Approach Analyzing School Concentration in Aligarh: A Hotspot Analysis Approach Read More »
#1 Exploring Amenity Mapping in Delhi: A Comprehensive Guide to Urban Planning #1 Exploring Amenity Mapping in Delhi: A Comprehensive Guide to Urban Planning Read More »
#1 Google Earth Engine: A Comprehensive Guide for Data Analysis and Visualization #1 Google Earth Engine: A Comprehensive Guide for Data Analysis and Visualization Read More »
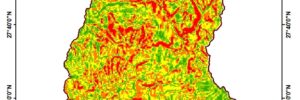
Exploring the SlopMap of Sikkim: A Comprehensive Guide to Understanding Sikkim’s Topography Exploring the SlopMap of Sikkim: A Comprehensive Guide to Understanding Sikkim’s Topography Read More »