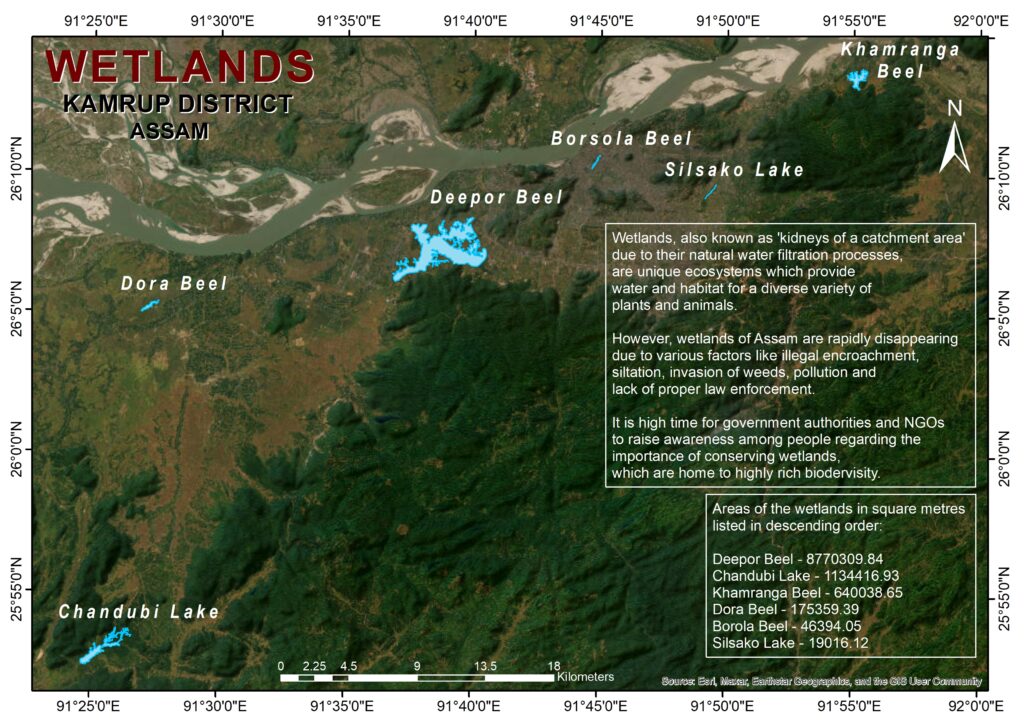
Agriculture Mapping in Panipat: Unlocking Potential for Sustainable Farming
Agriculture plays a vital role in Panipat, Haryana, where farming is a primary occupation. However, the rapidly changing climate and growing need for efficient land use have made traditional farming methods less viable. Agriculture mapping has emerged as a powerful tool for farmers in the region, helping them increase productivity, ensure sustainable practices, and make
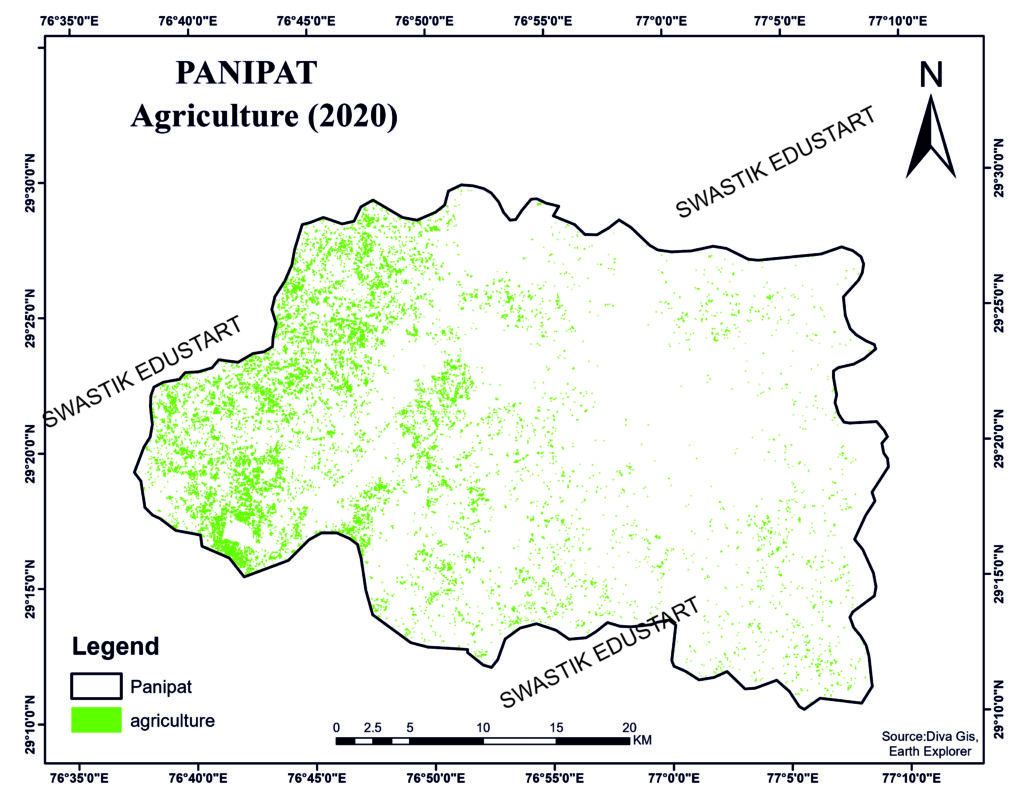
Analyzing School Concentration in Aligarh: A Hotspot Analysis Approach
Introduction Aligarh, a vibrant city in Uttar Pradesh, India, is known for its educational institutions, including the prestigious Aligarh Muslim University. As the demand for quality education grows, understanding the concentration of schools in Aligarh becomes critical for educators, planners, and policymakers. In this article, we will conduct a comprehensive hotspot analysis to identify areas
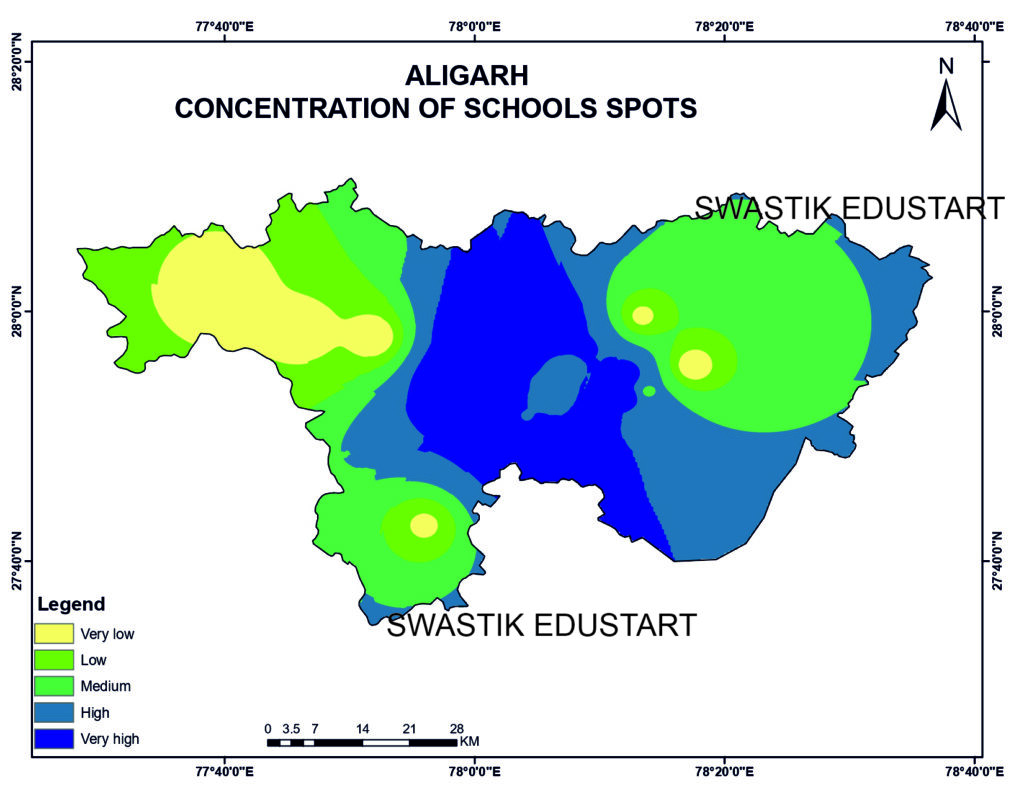
#1 Exploring Amenity Mapping in Delhi: A Comprehensive Guide to Urban Planning
Introduction Amenity mapping is a crucial aspect of urban planning, especially in a bustling metropolis like Delhi. With a population exceeding 20 million, the efficient distribution and accessibility of amenities such as parks, hospitals, schools, and transportation facilities are vital for enhancing the quality of life for residents. This article delves into the concept of
#1 Google Earth Engine: A Comprehensive Guide for Data Analysis and Visualization
In the age of big data, the ability to analyze and visualize geospatial information is more critical than ever. Google Earth Engine (GEE) is a powerful platform designed to handle this very task, offering unparalleled capabilities for data analysis and visualization. Whether you’re a researcher, data scientist, or environmental analyst, GEE can significantly enhance your
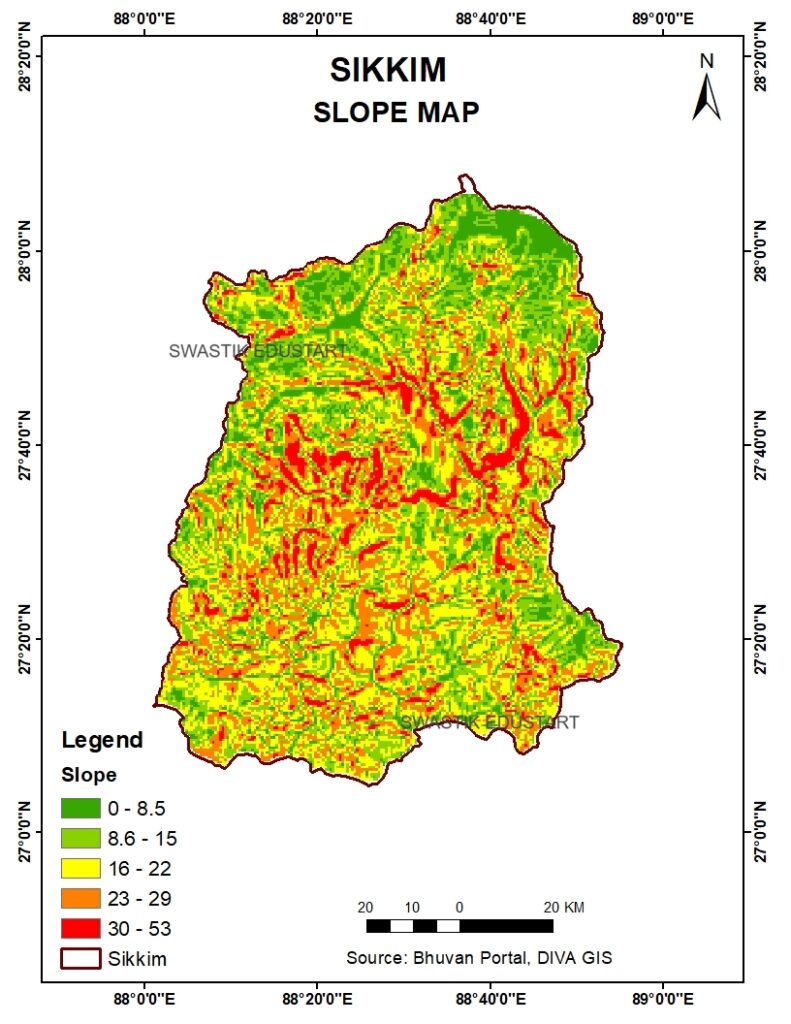
Exploring the SlopMap of Sikkim: A Comprehensive Guide to Understanding Sikkim’s Topography
SLOPMAP : Exploring the Slop Map of Sikkim: A Comprehensive Guide to Understanding Sikkim’s Topography Nestled in the northeastern part of India, Sikkim is a land of majestic mountains, lush valleys, and enchanting landscapes. Its dramatic topography makes it a haven for trekkers, nature enthusiasts, and adventure seekers. If you’re planning a trip to this
News & Updates
GIS Webinar on Future Scope of GIS and Remote Sensing
Registration Link : https://forms.gle/JsMhFro1tFMsW5326 GIS Webinar Date : 8th Sept. 2024Time : 7:00pm Future Scope of GIS and Remote Sensing E-certificate will be provide to participants No Registration Charges Register Now https://forms.gle/DvnBjVUxNqycJTka7
News & Updates
LANDSAT-8 in Focus: Mastering Image Interpretation Techniques
GENERAL INTRODUCTION **For further interpretation we then stack layers and then combine the bands according to the features appropriately visible. Bands can be combined ad arranged in a such unique way as to extract new and useful information. NATURAL COLOR (4,3,2): uses red, green and blue band combination; human eye resolution; healthy vegetation is green,