Introduction
Groundwater is the water found beneath the Earth’s surface in the cracks and spaces of soil, sand, and rock. It is stored within and moves slowly through geological formations known as aquifers, which are composed of soil, sand, and rock. The primary use of groundwater is for irrigating crops.
The groundwater level refers to the amount of water stored below the Earth’s surface. In any given geographic location, these levels are influenced by factors such as hydrogeological conditions, recharge rates, and groundwater extraction.
Factors Affecting Groundwater Levels
Rainfall: The main source of groundwater recharge.
Evapotranspiration: The loss of water through plant processes and evaporation.
Pumping: The extraction of groundwater for human use.
Land Use: Activities such as urbanization, deforestation, and agriculture can impact the infiltration and recharge of groundwater.
Groundwater levels are measured in terms of depth below ground level. The Central Ground Water Board (CGWB) regularly monitors these levels across the country through a network of monitoring wells. State governments also operate their own groundwater monitoring stations. All collected data is stored in the Water Information and Management System (WIMS), developed and maintained by the National Water Informatics Centre (NWIC).
Applications of GIS in Groundwater Level Monitoring
Groundwater Level Mapping and Analysis
Groundwater Potential Zone Mapping
Groundwater Recharge Assessment
Groundwater Quality Monitoring
Groundwater Modeling
Methodology
Data Collection:
Visit the India-WRIS website and navigate to the groundwater data section.
Select the source as CGWB, and choose the relevant state and district.
Note the values for x, y coordinates, average groundwater level, and the station name.
Data Processing:
Open MS Excel and enter the collected data. Save the file as a delimited text (.csv).
GIS Integration:
In ArcGIS, add the Excel sheet as a layer and display the x, y data.
Add the shapefile for the area of interest.
Use the IDW tool from the toolbar to create an interpolated surface.
Prepare a layout of the map.
Analysis
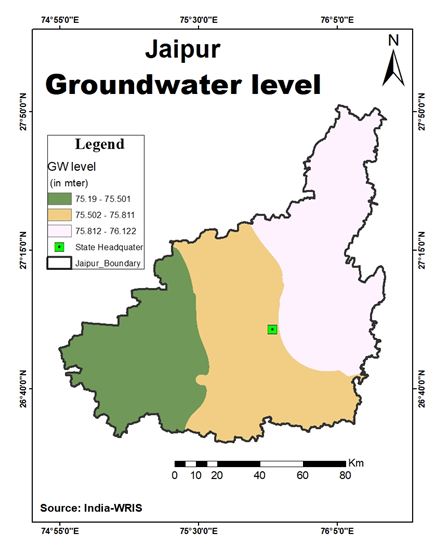
Case Study: Jaipur (May 2023 to May 2024)
Using the above methodology, a groundwater level map of Jaipur was prepared, highlighting three distinct levels:
High Groundwater Level: 75.812 – 76.122 (Indicated in light pink)
Moderate Groundwater Level: 75.502 – 75.811 (Indicated in light brown)
Low Groundwater Level: 75.19 – 75.501 (Indicated in green)
The data reveals a minimal variation in groundwater levels across Jaipur, providing valuable insights for water resource management.
Credit : Rituja Khandelwal (Diploma in GIS and RS – Swastik Edustart)